| |||||||||||||||||||||||||||||||||
All 57 seats to Plymouth City Council 29 seats needed for a majority | |||||||||||||||||||||||||||||||||
|---|---|---|---|---|---|---|---|---|---|---|---|---|---|---|---|---|---|---|---|---|---|---|---|---|---|---|---|---|---|---|---|---|---|
| |||||||||||||||||||||||||||||||||
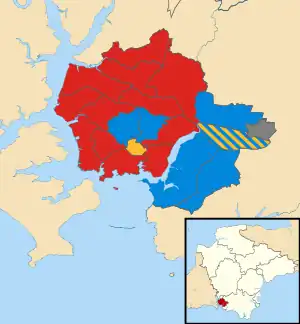 Map showing the results of contested wards in the 2003 Plymouth City Council elections. | |||||||||||||||||||||||||||||||||
| |||||||||||||||||||||||||||||||||
The 2003 Plymouth City Council election was held on 1 May 2003 to elect members of Plymouth City Council in England. This was on the same day as the other local elections. The election was the first to be contested under new ward boundaries, and as a result the entire council was up for election. The Labour Party regained control of the council, which it had lost to the Conservative Party at the previous election in 2000.[1][2][3]
Overall results
| Party | Seats | Gains | Losses | Net gain/loss | Seats % | Votes % | Votes | +/− | |
|---|---|---|---|---|---|---|---|---|---|
| Labour | 36 | 63.2 | 43.2 | 24,849 | |||||
| Conservative | 18 | 31.6 | 32.0 | 18,421 | |||||
| Liberal Democrats | 3 | 5.3 | 18.3 | 10,515 | |||||
| Plymouth Party | 0 | 0.0 | 1.8 | 1,046 | New | ||||
| Green | 0 | 0.0 | 1.7 | 976 | |||||
| UKIP | 0 | 0.0 | 1.3 | 753 | New | ||||
| Independent | 0 | 0.0 | 1.1 | 659 | |||||
| BNP | 0 | 0.0 | 0.3 | 192 | New | ||||
| Socialist Alliance (England) | 0 | 0.0 | 0.2 | 143 | New | ||||
| Total | 57 | 57,303 | |||||||
Ward results
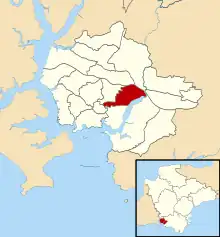
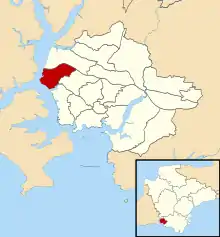
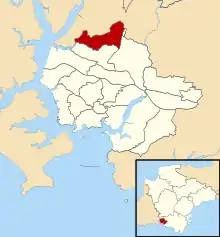
Budshead
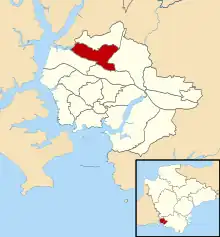
Location of Budshead ward
| Party | Candidate | Votes | % | ||
|---|---|---|---|---|---|
| Labour | R Simmonds | 1,487 | |||
| Labour | T Coleman | 1,439 | |||
| Labour | C Mavin | 1,408 | |||
| Conservative | P Brookshaw | 1,092 | |||
| Conservative | J Harden | 1,027 | |||
| Conservative | G Horler | 1,011 | |||
| Liberal Democrats | C Summerfield | 396 | |||
| Liberal Democrats | J Fitzroy | 394 | |||
| Liberal Democrats | R Dogan | 374 | |||
| Turnout | 31.0% | ||||
| Labour win (new seat) | |||||
| Labour win (new seat) | |||||
| Labour win (new seat) | |||||
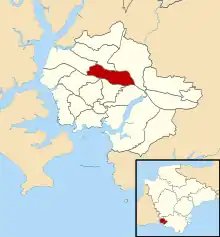
Compton
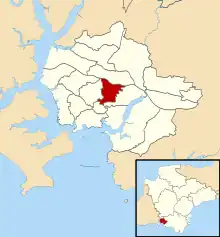
Location of Compton ward
| Party | Candidate | Votes | % | ||
|---|---|---|---|---|---|
| Conservative | D Stark | 1,458 | |||
| Conservative | A Fry | 1,436 | |||
| Conservative | T Savery | 1,413 | |||
| Labour | S Barker | 858 | |||
| Labour | S Oxenham | 825 | |||
| Labour | C Rennie | 821 | |||
| Liberal Democrats | R Fells | 720 | |||
| Liberal Democrats | M Walker | 712 | |||
| Liberal Democrats | R Casley | 710 | |||
| Turnout | 32.9% | ||||
| Conservative win (new seat) | |||||
| Conservative win (new seat) | |||||
| Conservative win (new seat) | |||||
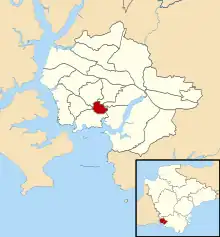
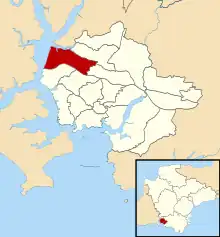
Devonport

Location of Devonport ward
| Party | Candidate | Votes | % | ||
|---|---|---|---|---|---|
| Labour | B Brotherton | 1,421 | |||
| Labour | W Stevens | 1,313 | |||
| Labour | N Wildy | 1,301 | |||
| Conservative | J Bell | 574 | |||
| Conservative | E Gray | 537 | |||
| Conservative | J Johnson | 509 | |||
| Liberal Democrats | C Prigmore | 290 | |||
| Liberal Democrats | T Colley | 251 | |||
| Liberal Democrats | C MacCullie | 248 | |||
| Independent | J Brooks | 245 | |||
| BNP | G Green | 192 | |||
| Plymouth Party | W Luck | 178 | |||
| Turnout | 26.1% | ||||
| Labour win (new seat) | |||||
| Labour win (new seat) | |||||
| Labour win (new seat) | |||||
Drake
Location of Drake ward
| Party | Candidate | Votes | % | ||
|---|---|---|---|---|---|
| Liberal Democrats | K Gillard | 580 | |||
| Liberal Democrats | D Santillo | 537 | |||
| Labour | R Bellamy | 380 | |||
| Labour | D Howells | 361 | |||
| Conservative | P Marshall | 281 | |||
| Conservative | C Miles | 272 | |||
| Socialist Alliance | P Heddle | 69 | |||
| Turnout | 18.6% | ||||
| Liberal Democrats win (new seat) | |||||
| Liberal Democrats win (new seat) | |||||
Efford and Lipson
Location of Efford and Lipson ward
| Party | Candidate | Votes | % | ||
|---|---|---|---|---|---|
| Labour | B Miller | 1,784 | |||
| Labour | A Kerswell | 1,766 | |||
| Labour | B Vincent | 1,752 | |||
| Liberal Democrats | N Sewell | 634 | |||
| Liberal Democrats | D Wood | 619 | |||
| Conservative | M Orchard | 613 | |||
| Liberal Democrats | L Burrows | 607 | |||
| Conservative | R Lloyd | 583 | |||
| Conservative | R McVicar | 554 | |||
| Turnout | 31.7% | ||||
| Labour win (new seat) | |||||
| Labour win (new seat) | |||||
| Labour win (new seat) | |||||
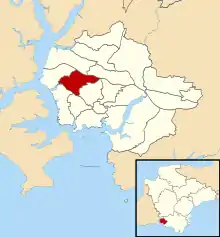
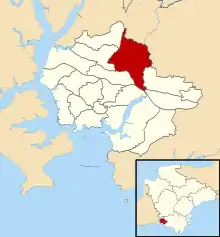
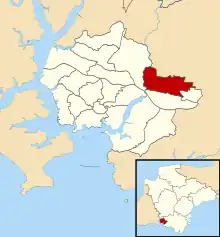
Eggbuckland
Location of Eggbuckland ward
| Party | Candidate | Votes | % | ||
|---|---|---|---|---|---|
| Labour | D Bray | 1,387 | |||
| Labour | L Finn | 1,323 | |||
| Labour | S Lemin | 1,278 | |||
| Conservative | C Nunn | 1,182 | |||
| Conservative | M Foster | 1,164 | |||
| Conservative | P Rowe | 1,158 | |||
| Liberal Democrats | M Bellamy | 584 | |||
| Liberal Democrats | R Bellamy | 560 | |||
| Liberal Democrats | T Smith | 511 | |||
| Turnout | 32.5% | ||||
| Labour win (new seat) | |||||
| Labour win (new seat) | |||||
| Labour win (new seat) | |||||
Ham
Location of Ham ward
| Party | Candidate | Votes | % | ||
|---|---|---|---|---|---|
| Labour | Tudor Evans | 1,912 | |||
| Labour | I Gordon | 1,784 | |||
| Labour | C Pattison | 1,746 | |||
| Conservative | S Ashcroft | 553 | |||
| Conservative | D Bothwick | 507 | |||
| Conservative | T Thomas | 503 | |||
| Liberal Democrats | M Black | 407 | |||
| Liberal Democrats | K Black | 394 | |||
| Liberal Democrats | L Pearson | 330 | |||
| Plymouth Party | S Charles | 166 | |||
| Turnout | 29.9% | ||||
| Labour win (new seat) | |||||
| Labour win (new seat) | |||||
| Labour win (new seat) | |||||
Honicknowle
Location of Honicknowle ward
| Party | Candidate | Votes | % | ||
|---|---|---|---|---|---|
| Labour | P Carter | 1,689 | |||
| Labour | P Purnell | 1,611 | |||
| Labour | P Smith | 1,574 | |||
| Conservative | B Baker | 520 | |||
| Conservative | R Mahony | 502 | |||
| Conservative | J Coope | 489 | |||
| Liberal Democrats | J Crocker | 422 | |||
| Liberal Democrats | M O'Neil | 374 | |||
| Liberal Democrats | M Swann | 362 | |||
| Turnout | 25.6% | ||||
| Labour win (new seat) | |||||
| Labour win (new seat) | |||||
| Labour win (new seat) | |||||
Moor View
Location of Moor View ward
| Party | Candidate | Votes | % | ||
|---|---|---|---|---|---|
| Labour | S Dann | 1,527 | |||
| Labour | M Fox | 1,489 | |||
| Labour | P Hutchings | 1,474 | |||
| Conservative | H Ellis | 899 | |||
| Conservative | J Ellis | 863 | |||
| Conservative | A Sloggett | 829 | |||
| Liberal Democrats | A Campbell | 491 | |||
| Liberal Democrats | D Spreat | 408 | |||
| Liberal Democrats | J Spreat | 401 | |||
| Turnout | 30.4% | ||||
| Labour win (new seat) | |||||
| Labour win (new seat) | |||||
| Labour win (new seat) | |||||
Peverell
Location of Peverell ward
| Party | Candidate | Votes | % | ||
|---|---|---|---|---|---|
| Conservative | J Mahony | 1,435 | |||
| Conservative | M Leaves | 1,373 | |||
| Conservative | P Nicholson | 1,354 | |||
| Labour | C Woodman | 1,049 | |||
| Labour | C Rose | 1,002 | |||
| Labour | R Sharman | 980 | |||
| Liberal Democrats | V Costain | 847 | |||
| Liberal Democrats | E Swann | 792 | |||
| Liberal Democrats | M Shally | 763 | |||
| Green | F Allen | 322 | |||
| UKIP | R Sigrist | 301 | |||
| UKIP | C Bragg | 284 | |||
| UKIP | P Martin-Kaye | 260 | |||
| Independent | A Sherry | 85 | |||
| Turnout | 37.8% | ||||
| Labour win (new seat) | |||||
| Labour win (new seat) | |||||
| Labour win (new seat) | |||||
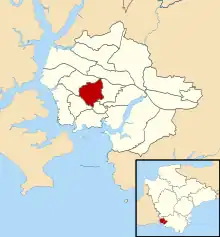
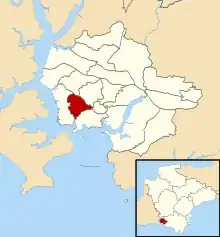
Plympton Chaddlewood
Location of Plympton Chaddlewood ward
| Party | Candidate | Votes | % | ||
|---|---|---|---|---|---|
| Conservative | G Jordan | 601 | |||
| Conservative | D Salter | 572 | |||
| Liberal Democrats | J Byatt | 377 | |||
| Labour | P Murphy | 352 | |||
| Liberal Democrats | P Hutty | 312 | |||
| Labour | J Wood | 308 | |||
| Independent | D Every | 211 | |||
| Turnout | 23.6% | ||||
| Conservative win (new seat) | |||||
| Conservative win (new seat) | |||||
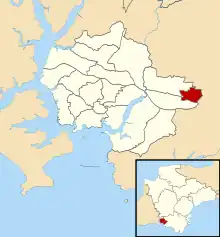
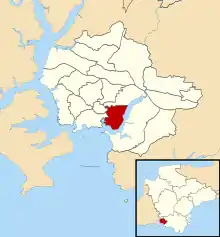
Plympton Erle
Location of Plympton Erle ward
| Party | Candidate | Votes | % | ||
|---|---|---|---|---|---|
| Conservative | J Fox | 783 | |||
| Liberal Democrats | E Lock | 764 | |||
| Labour | R Burns | 713 | |||
| Conservative | D Birkenhead | 697 | |||
| Liberal Democrats | S Jennett | 668 | |||
| Labour | M Robinson | 586 | |||
| Turnout | 31.8% | ||||
| Conservative win (new seat) | |||||
| Liberal Democrats win (new seat) | |||||
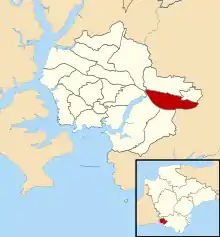
Plympton St Mary
Location of Plympton St Mary ward
| Party | Candidate | Votes | % | ||
|---|---|---|---|---|---|
| Conservative | P Nicholson | 1,848 | |||
| Conservative | D James | 1,741 | |||
| Conservative | D Ford | 1,661 | |||
| Labour | J Henley | 998 | |||
| Labour | V Burns | 955 | |||
| Labour | S Robinson | 860 | |||
| Liberal Democrats | P Fewings | 638 | |||
| Liberal Democrats | A Cains | 583 | |||
| Liberal Democrats | M Trench | 478 | |||
| Turnout | 34.9% | ||||
| Conservative win (new seat) | |||||
| Conservative win (new seat) | |||||
| Conservative win (new seat) | |||||
Plymstock Dunstone
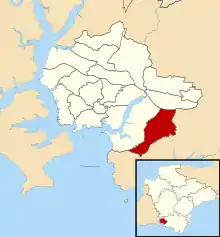
Location of Plymstock Dunstone ward
| Party | Candidate | Votes | % | ||
|---|---|---|---|---|---|
| Conservative | D Viney | 1,866 | |||
| Conservative | V Pengelly | 1,769 | |||
| Conservative | K Wigens | 1,681 | |||
| Labour | R Evans | 975 | |||
| Labour | C Childs | 842 | |||
| Labour | D Roche | 808 | |||
| Liberal Democrats | P Jones | 482 | |||
| Liberal Democrats | R Tofts | 481 | |||
| Liberal Democrats | J Evans | 478 | |||
| Turnout | 29.8% | ||||
| Conservative win (new seat) | |||||
| Conservative win (new seat) | |||||
| Conservative win (new seat) | |||||
Plymstock Radford

Location of Plymstock Radford ward
| Party | Candidate | Votes | % | ||
|---|---|---|---|---|---|
| Conservative | K Foster | 1,208 | |||
| Conservative | W Foster | 1,156 | |||
| Conservative | M Leaves | 1,128 | |||
| Labour | R Dodd | 1,123 | |||
| Labour | J Clynch | 1,062 | |||
| Labour | W Wraight | 844 | |||
| Liberal Democrats | C Burrows | 500 | |||
| UKIP | R Bullock | 452 | |||
| UKIP | A Skuse | 414 | |||
| UKIP | D McCallum | 408 | |||
| Liberal Democrats | M Chandler | 405 | |||
| Liberal Democrats | S Kendrick | 372 | |||
| Turnout | 34.2% | ||||
| Conservative win (new seat) | |||||
| Conservative win (new seat) | |||||
| Conservative win (new seat) | |||||
St Budeax
Location of St Budeaux ward
| Party | Candidate | Votes | % | ||
|---|---|---|---|---|---|
| Labour | G Wheeler | 1,560 | |||
| Labour | C Blackburn | 1,475 | |||
| Labour | D Williams | 1,426 | |||
| Conservative | H Plymsol | 520 | |||
| Conservative | P Crolla | 513 | |||
| Liberal Democrats | R McSweeney | 449 | |||
| Conservative | M White | 421 | |||
| Liberal Democrats | G Hirst | 379 | |||
| Liberal Democrats | M Gallagher | 371 | |||
| Turnout | 24.9% | ||||
| Labour win (new seat) | |||||
| Labour win (new seat) | |||||
| Labour win (new seat) | |||||
St Peter and the Waterfront
Location of St Peter and the Waterfront ward
| Party | Candidate | Votes | % | ||
|---|---|---|---|---|---|
| Labour | M King | 1,040 | |||
| Labour | T Wildy | 963 | |||
| Labour | V Hiromeris | 958 | |||
| Conservative | F Brimacombe | 728 | |||
| Conservative | A Angel | 670 | |||
| Conservative | E Shillabeer | 588 | |||
| Liberal Democrats | H Stone | 535 | |||
| Liberal Democrats | J Newton | 475 | |||
| Liberal Democrats | T Wickett | 434 | |||
| Plymouth Party | K Kelway | 365 | |||
| Plymouth Party | J Broughton | 264 | |||
| Plymouth Party | S Billows | 242 | |||
| Green | F Williamson | 172 | |||
| Independent | S Ellis | 118 | |||
| Turnout | 27.8% | ||||
| Labour win (new seat) | |||||
| Labour win (new seat) | |||||
| Labour win (new seat) | |||||
Southway
Location of Southway ward
| Party | Candidate | Votes | % | ||
|---|---|---|---|---|---|
| Labour | D Camp | 1,996 | |||
| Labour | J Kirk | 1,728 | |||
| Labour | D Weekes | 1,620 | |||
| Conservative | E Willey | 836 | |||
| Conservative | E Dawson | 732 | |||
| Conservative | J Plymsol | 731 | |||
| Liberal Democrats | T O'Connor | 372 | |||
| Liberal Democrats | C Curry | 333 | |||
| Liberal Democrats | B Yardley | 292 | |||
| Turnout | 27.8% | ||||
| Labour win (new seat) | |||||
| Labour win (new seat) | |||||
| Labour win (new seat) | |||||
Stoke
Location of Stoke ward
| Party | Candidate | Votes | % | ||
|---|---|---|---|---|---|
| Labour | M Fletcher | 1,128 | |||
| Labour | G Shears | 1,045 | |||
| Labour | D Haydon | 1,007 | |||
| Conservative | C Pascoe | 935 | |||
| Conservative | Y Dawson | 926 | |||
| Conservative | G Monaghan | 877 | |||
| Liberal Democrats | H Guy | 506 | |||
| Liberal Democrats | S Guy | 469 | |||
| Liberal Democrats | N Wickett | 422 | |||
| Green | J Cavanagh | 287 | |||
| Plymouth Party | I Fleming | 178 | |||
| Plymouth Party | K Woodward | 170 | |||
| Turnout | 29.0% | ||||
| Labour win (new seat) | |||||
| Labour win (new seat) | |||||
| Labour win (new seat) | |||||
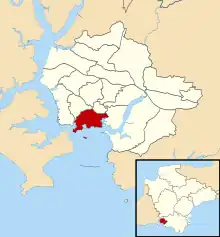
Sutton and Mount Gould
Location of Sutton and Mount Gould ward
| Party | Candidate | Votes | % | ||
|---|---|---|---|---|---|
| Labour | J Nelder | 1,470 | |||
| Labour | M Aspinall | 1,452 | |||
| Labour | E Rennie | 1,337 | |||
| Liberal Democrats | C Brown | 521 | |||
| Liberal Democrats | P York | 492 | |||
| Conservative | J Parry | 489 | |||
| Conservative | R Welchman | 486 | |||
| Conservative | J White | 472 | |||
| Liberal Democrats | G Nye | 429 | |||
| Green | T Mitchell | 195 | |||
| Plymouth Party | D Kelway | 159 | |||
| Plymouth Party | R Brierley | 127 | |||
| Socialist Alliance | R Manning | 74 | |||
| Socialist Alliance | E Peonides | 69 | |||
| Socialist Alliance | P Tozer | 48 | |||
| Turnout | 28.0% | ||||
| Labour win (new seat) | |||||
| Labour win (new seat) | |||||
| Labour win (new seat) | |||||
References
- ↑ "Local elections 2003" (PDF). parliament.uk. Archived from the original (PDF) on 10 May 2020. Retrieved 18 March 2019.
- ↑ "Local Election Results 2003". Andrew Teale.
- ↑ "Plymouth City Council Election Results 1997-2012" (PDF). Elections Centre.
- ↑ "| PLYMOUTH.GOV.UK". www.plymouth.gov.uk.
This article is issued from Wikipedia. The text is licensed under Creative Commons - Attribution - Sharealike. Additional terms may apply for the media files.