| ||
|
| ||
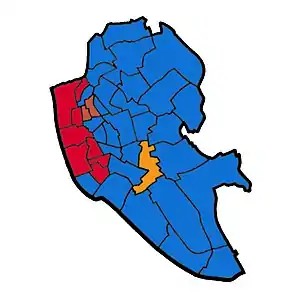 Map of Liverpool showing wards won (first placed party)[1] | ||
Elections to Liverpool City Council were held on 8 May 1969.
After the election, the composition of the council was:
| Party | Councillors | ± | Aldermen | |
|---|---|---|---|---|
| Conservative | 87 | +9 | ?? | |
| Labour | 23 | -10 | ?? | |
| Liberal | 3 | +1 | ?? | |
| Protestant | 7 | 0 | ?? | |
Election result
| Party | Seats | Gains | Losses | Net gain/loss | Seats % | Votes % | Votes | +/− | |
|---|---|---|---|---|---|---|---|---|---|
| Conservative | 29 | 11 | 2 | +9 | 72% | 60% | 76,255 | ||
| Labour | 8 | 1 | 11 | -10 | 20% | 28% | 35,402 | ||
| Liberal | 1 | 1 | 0 | +1 | 2.5% | 8% | 9,974 | ||
| Protestant | 2 | 0 | 0 | 0 | 5% | 1.5% | 1,889 | ||
| Communist | 0 | 0 | 0 | 0 | 0% | 1.8% | 2,275 | ||
| National Front | 0 | 0 | 0 | 0 | 0% | 0.43% | 551 | ||
Ward results
* - Councillor seeking re-election
(PARTY) - Party of former Councillor
The Councillors seeking re-election at this election were elected in 1966 for a three-year term, therefore comparisons are made with the 1966 election results.
Abercromby
| Party | Candidate | Votes | % | ±% | |
|---|---|---|---|---|---|
| Labour | William F. Burke * | 515 | 44% | -15% | |
| Conservative | Stanley V. Hennessy | 449 | 39% | +7% | |
| Communist | Anthony McClelland | 158 | 14% | +5% | |
| National Front | Elvyn Thompson | 39 | 3% | ||
| Majority | 66 | ||||
| Registered electors | 5,557 | ||||
| Turnout | 1,161 | 21% | +4% | ||
| Labour hold | Swing | ||||
Aigburth
| Party | Candidate | Votes | % | ±% | |
|---|---|---|---|---|---|
| Conservative | Sydney T. Moss (PARTY) | 4,429 | 92% | +20% | |
| Labour | Andrew Williams | 394 | 8% | 0% | |
| Majority | 4,035 | ||||
| Registered electors | 13,462 | ||||
| Turnout | 4,823 | 36% | 0% | ||
| Conservative hold | Swing | ||||
Allerton
| Party | Candidate | Votes | % | ±% | |
|---|---|---|---|---|---|
| Conservative | David E. Williams * | 2,723 | 70% | +2% | |
| Liberal | Miss Jean E. Freeman | 880 | 23% | +1% | |
| Labour | Frank W. Longworth | 292 | 7% | -3% | |
| Majority | 1,843 | ||||
| Registered electors | 9,950 | ||||
| Turnout | 3,895 | 39% | +5% | ||
| Conservative hold | Swing | ||||
Anfield
| Party | Candidate | Votes | % | ±% | |
|---|---|---|---|---|---|
| Conservative | Robert G. Semple * | 2,897 | 76% | +13% | |
| Labour | John D. Hamilton | 913 | 24% | -13% | |
| Majority | 2,431 | ||||
| Registered electors | 12,894 | ||||
| Turnout | 3,810 | 30% | -1% | ||
| Conservative hold | Swing | ||||
Arundel
| Party | Candidate | Votes | % | ±% | |
|---|---|---|---|---|---|
| Conservative | Kevin W. Edwards * | 2,331 | 62% | -2% | |
| Liberal | Leonard Tyrer | 731 | 19% | +19% | |
| Labour | Mrs. Mabel Evans | 519 | 14% | -20% | |
| Communist | Jack Kay | 127 | 3% | +1% | |
| National Front | Eric Tomlinson | 127 | 3% | +1% | |
| Majority | 1,600 | ||||
| Registered electors | 12,245 | ||||
| Turnout | 3,766 | 31% | +2% | ||
| Conservative hold | Swing | ||||
Breckfield
| Party | Candidate | Votes | % | ±% | |
|---|---|---|---|---|---|
| Conservative | Michael W. Maxwell | 1,552 | 54% | +6% | |
| Labour | Len Williams * | 801 | 28% | -24% | |
| Liberal | Michael V. Lilley | 508 | 18% | +18% | |
| Majority | 751 | ||||
| Registered electors | 9,617 | ||||
| Turnout | 2,861 | 30% | +6% | ||
| Conservative gain from Labour | Swing | ||||
Broadgreen
| Party | Candidate | Votes | % | ±% | |
|---|---|---|---|---|---|
| Conservative | Daniel J. Jones | 1,913 | 57% | -9% | |
| Liberal | Thomas R. W. Johnston | 1,016 | 30% | +19% | |
| Labour | Michael Black (PARTY) | 429 | 13% | -10% | |
| Majority | 897 | ||||
| Registered electors | 10,893 | ||||
| Turnout | 3,358 | 31% | +1% | ||
| Conservative hold | Swing | ||||
Central
| Party | Candidate | Votes | % | ±% | |
|---|---|---|---|---|---|
| Labour | George G. Maloney | 1,226' | 49% | 0% | |
| Conservative | Barry V. Groombridge | 1,216 | 49% | -2% | |
| Communist | Thomas R. Woods | 57 | 2% | +2% | |
| Majority | 10 | ||||
| Registered electors | 6,946 | ||||
| Turnout | 2,499 | 36% | -10% | ||
| Labour gain from Conservative | Swing | ||||
Childwall
| Party | Candidate | Votes | % | ±% | |
|---|---|---|---|---|---|
| Conservative | Frank H. Andrews (PARTY) | 4,405 | 73% | +22% | |
| Liberal | Harry Davies | 1,108 | 18% | -21% | |
| Labour | Anthony Mulhearn | 407 | 7% | -1% | |
| Majority | 3,297 | ||||
| Registered electors | 17,336 | ||||
| Turnout | 6,044 | 35% | +9% | ||
| Conservative hold | Swing | ||||
Church
| Party | Candidate | Votes | % | ±% | |
|---|---|---|---|---|---|
| Liberal | Reginald F. Atkins | 3,573 | 55% | +13% | |
| Conservative | Herbert R. Balmer | 2,761 | 42% | -10% | |
| Labour | Charles H. Winter | 179 | 3% | -2% | |
| Majority | 812 | ||||
| Registered electors | 13,463 | ||||
| Turnout | 6,513 | 48% | +7% | ||
| Liberal gain from Conservative | Swing | ||||
Clubmoor
| Party | Candidate | Votes | % | ±% | |
|---|---|---|---|---|---|
| Conservative | Ernest Johnson * | 2,273 | 62% | +4% | |
| Labour | Kenneth Stewart | 1,383 | 38% | -4% | |
| Majority | 890 | ||||
| Registered electors | 10,285 | ||||
| Turnout | 3,656 | 36% | +2% | ||
| Conservative hold | Swing | ||||
County
| Party | Candidate | Votes | % | ±% | |
|---|---|---|---|---|---|
| Conservative | William Thomas * | 2,760 | 67% | +15% | |
| Labour | Terence Roberts | 1,093 | 27% | -21% | |
| Communist | Kenneth T. Dowd | 251 | 6% | +6% | |
| Majority | 1,667 | ||||
| Registered electors | 12,643 | ||||
| Turnout | 4,104 | 32% | 0% | ||
| Conservative hold | Swing | ||||
Croxteth
| Party | Candidate | Votes | % | ±% | |
|---|---|---|---|---|---|
| Conservative | Alexander L. Audley * | 3,457 | 87% | +8% | |
| Labour | Rodney Ludvigsen | 500 | 13% | -8% | |
| Majority | 2,957 | ||||
| Registered electors | 11,765 | ||||
| Turnout | 3,957 | 34% | -2% | ||
| Conservative hold | Swing | ||||
Dingle
| Party | Candidate | Votes | % | ±% | |
|---|---|---|---|---|---|
| Conservative | John H. Lea | 1,655 | 49% | +10% | |
| Labour | Daniel Cumella * | 1,485 | 44% | -17% | |
| Communist | John Cook | 134 | 4% | +4% | |
| National Front | Douglas H. Kewley | 76 | 2% | +2% | |
| Majority | 170 | ||||
| Registered electors | 10,291 | ||||
| Turnout | 3,350 | 33% | +5% | ||
| Conservative gain from Labour | Swing | ||||
Dovecot
| Party | Candidate | Votes | % | ±% | |
|---|---|---|---|---|---|
| Conservative | John L. Walsh * | 2,307 | 57% | +7% | |
| Labour | Wilfred P. Johnson | 1,725 | 43% | -7% | |
| Majority | 582 | ||||
| Registered electors | 15,266 | ||||
| Turnout | 4,032 | 26% | +1% | ||
| Conservative hold | Swing | ||||
Everton
| Party | Candidate | Votes | % | ±% | |
|---|---|---|---|---|---|
| Conservative | Ralph S. Charles | 388 | |||
| Labour | Sydney F. Jacobs | 378 | 48% | -21% | |
| Majority | 10 | ||||
| Registered electors | 4,142 | ||||
| Turnout | 795 | 19% | +7% | ||
| Conservative gain from Labour | Swing | ||||
Fairfield
| Party | Candidate | Votes | % | ±% | |
|---|---|---|---|---|---|
| Conservative | George H. Hesketh (PARTY) | 2,101 | 74% | +15% | |
| Labour | Harold Lee | 744 | 26% | -15% | |
| Majority | 1,357 | ||||
| Registered electors | 12,002 | ||||
| Turnout | 2,845 | 24% | -11% | ||
| Conservative hold | Swing | ||||
Fazakerley
| Party | Candidate | Votes | % | ±% | |
|---|---|---|---|---|---|
| Conservative | Alan Lloyd * | 2,498 | 76% | +19% | |
| Labour | James M. Burke | 802 | 24% | -19% | |
| Majority | 1,696 | ||||
| Registered electors | 10,968 | ||||
| Turnout | 3,300 | 30% | -5% | ||
| Conservative hold | Swing | ||||
Gillmoss
| Party | Candidate | Votes | % | ±% | |
|---|---|---|---|---|---|
| Conservative | George Smith | 2,090 | 50% | +16% | |
| Labour | John F. Stevens * | 1,850 | 44% | -22% | |
| Communist | John B. Cartwright | 239 | 6% | +6% | |
| Majority | 240 | ||||
| Registered electors | 17,751 | ||||
| Turnout | 4,179 | 24% | +6% | ||
| Conservative gain from Labour | Swing | ||||
Granby
| Party | Candidate | Votes | % | ±% | |
|---|---|---|---|---|---|
| Labour | Mrs. Margaret B. Simey * | 1,204 | 50% | -14% | |
| Conservative | David Greenaway | 1,098 | 46% | +14% | |
| Communist | Frederick Gleeson | 102 | 4% | 0% | |
| Majority | 106 | ||||
| Registered electors | 9,371 | ||||
| Turnout | 2,404 | 26% | +4% | ||
| Labour hold | Swing | ||||
Kensington
| Party | Candidate | Votes | % | ±% | |
|---|---|---|---|---|---|
| Conservative | James G. Barrett | 1,627 | 54% | +17% | |
| Labour | Edward Burke | 735 | 25% | -38% | |
| Ind. Labour Party | T. K. Williams * | 578 | 19% | ||
| National Front | William G. Clarkson | 49 | 2% | +2% | |
| Majority | 892 | ||||
| Registered electors | 10,465 | ||||
| Turnout | 2,989 | 29% | +5% | ||
| Conservative gain from Labour | Swing | ||||
Low Hill
| Party | Candidate | Votes | % | ±% | |
|---|---|---|---|---|---|
| Conservative | Thomas P. Pink | 844 | 57% | +20% | |
| Labour | George M. Scott | 577 | 39% | -20% | |
| National Front | Richard J. Williams | 49 | 3% | ||
| Majority | 267 | ||||
| Registered electors | 5,146 | ||||
| Turnout | 1,470 | 29% | +7% | ||
| Conservative gain from Labour | Swing | ||||
Melrose
| Party | Candidate | Votes | % | ±% | |
|---|---|---|---|---|---|
| Labour | Benjamin Shaw (PARTY) | 904 | 50% | -13% | |
| Conservative | Charles E. Ratcliffe | 901 | 50% | +13% | |
| Majority | 3 | ||||
| Registered electors | 7,389 | ||||
| Turnout | 1,805 | 24% | +8% | ||
| Labour hold | Swing | ||||
Netherfield
| Party | Candidate | Votes | % | ±% | |
|---|---|---|---|---|---|
| Protestant | William Owen * | 579 | 70% | +3% | |
| Labour | Edward Loyden | 194 | 23% | -6% | |
| Communist | Frank Cartwright | 54 | 7% | +3% | |
| Majority | 385 | ||||
| Registered electors | 3,984 | ||||
| Turnout | 827 | 21% | +3% | ||
| Protestant hold | Swing | ||||
Old Swan
| Party | Candidate | Votes | % | ±% | |
|---|---|---|---|---|---|
| Conservative | Norman F. Derrick * | 2,036 | 45% | -5% | |
| Liberal | Doreen Jones | 1,853 | 41% | +32% | |
| Labour | Stanley G. Thorne | 626 | 14% | -28% | |
| Majority | 1,410 | ||||
| Registered electors | 13,091 | ||||
| Turnout | 4,515 | 34% | +5% | ||
| Conservative hold | Swing | ||||
Picton
| Party | Candidate | Votes | % | ±% | |
|---|---|---|---|---|---|
| Conservative | Thomas Lyrian Hobday * | 2,095 | 62% | +11% | |
| Labour | William R. Snell | 1,145 | 34% | -15% | |
| National Front | Douglas Richardson | 155 | 5% | ||
| Majority | 950 | ||||
| Registered electors | 12,183 | ||||
| Turnout | 3,395 | 28% | 0% | ||
| Conservative hold | Swing | ||||
Pirrie
| Party | Candidate | Votes | % | ±% | |
|---|---|---|---|---|---|
| Conservative | Ivor P. Balmer | 2,600 | 60% | +11% | |
| Labour | John McLean * | 1,768 | 40% | -11% | |
| Majority | 832 | ||||
| Registered electors | 15,445 | ||||
| Turnout | 4,368 | 28% | +1% | ||
| Conservative gain from Labour | Swing | ||||
Prince's Park
| Party | Candidate | Votes | % | ±% | |
|---|---|---|---|---|---|
| Labour | Dr. Cyril Taylor * | 1,655 | 50% | -7% | |
| Conservative | Robert S. Jones | 1,459 | 44% | +4% | |
| Communist | John Humes | 188 | 6% | +3% | |
| Majority | 196 | ||||
| Registered electors | 10,863 | ||||
| Turnout | 3,302 | 30% | +4% | ||
| Labour hold | Swing | ||||
Sandhills
| Party | Candidate | Votes | % | ±% | |
|---|---|---|---|---|---|
| Labour | Vincent P. Hyams (PARTY) | 1,001 | 60% | -20% | |
| Conservative | Alfred W. Jones | 605 | 36% | +19% | |
| Communist | Robert Cartwright | 73 | 4% | +1% | |
| Majority | 396 | ||||
| Registered electors | 6,649 | ||||
| Turnout | 1,679 | 25% | +4% | ||
| Labour hold | Swing | ||||
St. Domingo
| Party | Candidate | Votes | % | ±% | |
|---|---|---|---|---|---|
| Protestant | Harold W. Blower * | 1,310 | 61% | +7% | |
| Labour | Thomas McManus | 763 | 36% | -10% | |
| Communist | Kenneth Dunlop | 74 | 3% | ||
| Majority | 547 | ||||
| Registered electors | 9,181 | ||||
| Turnout | 2,147 | 23% | +1% | ||
| Protestant hold | Swing | ||||
St. James
| Party | Candidate | Votes | % | ±% | |
|---|---|---|---|---|---|
| Labour | Edward Shields (PARTY) | 1,442 | 51% | -12% | |
| Conservative | Cyril Smith | 711 | 25% | -1% | |
| Communist | Roger O'Hara | 622 | 22% | +11% | |
| National Front | Kevin Keatley | 58 | 2% | ||
| Majority | 731 | ||||
| Registered electors | 8,533 | ||||
| Turnout | 2,833 | 33% | +17% | ||
| Labour hold | Swing | ||||
St. Mary's
| Party | Candidate | Votes | % | ±% | |
|---|---|---|---|---|---|
| Conservative | Robert E. Lloyd | 2,150 | 68% | +18% | |
| Labour | Patrick Grannell * | 1,031 | 32% | -18% | |
| Majority | 1,119 | ||||
| Registered electors | 9,842 | ||||
| Turnout | 3,181 | 32% | +2% | ||
| Conservative gain from Labour | Swing | ||||
St. Michael's
| Party | Candidate | Votes | % | ±% | |
|---|---|---|---|---|---|
| Conservative | Eric S. Nixon * | 2,568 | 81% | +24% | |
| Labour | Alfonso Samosa | 617 | 19% | -2% | |
| Majority | 1,951 | ||||
| Registered electors | 11,265 | ||||
| Turnout | 3,185 | 28% | -10% | ||
| Conservative hold | Swing | ||||
Smithdown
| Party | Candidate | Votes | % | ±% | |
|---|---|---|---|---|---|
| Conservative | James W. Butler | 740 | 54% | +15% | |
| Labour | W. Gibbs * | 555 | 41% | -20% | |
| National Front | Thomas Everall | 67 | 5% | ||
| Majority | 185 | ||||
| Registered electors | 7,777 | ||||
| Turnout | 1,362 | 18% | +3% | ||
| Conservative gain from Labour | Swing | ||||
Speke
| Party | Candidate | Votes | % | ±% | |
|---|---|---|---|---|---|
| Conservative | Edwin M. Clein | 1,677 | 56% | +13% | |
| Labour | Francis J. McConville * | 1,317 | 44% | -13% | |
| Majority | 360 | ||||
| Registered electors | 13,603 | ||||
| Turnout | 2,994 | 22% | +9% | ||
| Conservative gain from Labour | Swing | ||||
Tuebrook
| Party | Candidate | Votes | % | ±% | |
|---|---|---|---|---|---|
| Conservative | Michael P. Tinne * | 2,468 | 70% | +14% | |
| Labour | David M. Mitchell | 1,037 | 30% | -14% | |
| Majority | 1,431 | ||||
| Registered electors | 11,265 | ||||
| Turnout | 3,505 | 31% | -1% | ||
| Conservative hold | Swing | ||||
Vauxhall
| Party | Candidate | Votes | % | ±% | |
|---|---|---|---|---|---|
| Labour | Frank Marsden (PARTY) | 823 | 68% | -21% | |
| Liberal | James A. Gallagher | 305 | 25% | ||
| Conservative | Peter S. Jones | 45 | 4% | -2% | |
| Communist | Thomas E. Cassin | 43 | 4% | -1% | |
| Majority | 518 | ||||
| Registered electors | 6,265 | ||||
| Turnout | 1,216 | 19% | +9% | ||
| Labour hold | Swing | ||||
Warbreck
| Party | Candidate | Votes | % | ±% | |
|---|---|---|---|---|---|
| Conservative | Ralph H. Morris * | 2,593 | 79% | +15% | |
| Labour | Edward T. Mooney | 683 | 21% | -15% | |
| Majority | 1,910 | ||||
| Registered electors | 11,676 | ||||
| Turnout | 3,276 | 28% | 0% | ||
| Conservative hold | Swing | ||||
Westminster
| Party | Candidate | Votes | % | ±% | |
|---|---|---|---|---|---|
| Conservative | James Wareing | 1,081 | 58% | -15% | |
| Labour | James Gardner * | 792 | 42% | -15% | |
| Majority | 289 | ||||
| Registered electors | 5,864 | ||||
| Turnout | 1,873 | ||||
| Conservative gain from Labour | Swing | ||||
Woolton
| Party | Candidate | Votes | % | ±% | |
|---|---|---|---|---|---|
| Conservative | James McAllister * | 4,752 | 84% | +9% | |
| Labour | Robert C. Evans | 898 | 16% | ||
| Majority | 3,854 | ||||
| Registered electors | 20,849 | ||||
| Turnout | 5,650 | 27% | -1% | ||
| Conservative hold | Swing | ||||
References
- ↑ Jeffery, David. "Merseyside Local Election Results Project". Dr David Jeffery. Retrieved 14 April 2021.
- ↑ Liverpool Daily Post 9 May 1969
- ↑ Liverpool City Council Proceedings of the Council 1969-1970
This article is issued from Wikipedia. The text is licensed under Creative Commons - Attribution - Sharealike. Additional terms may apply for the media files.